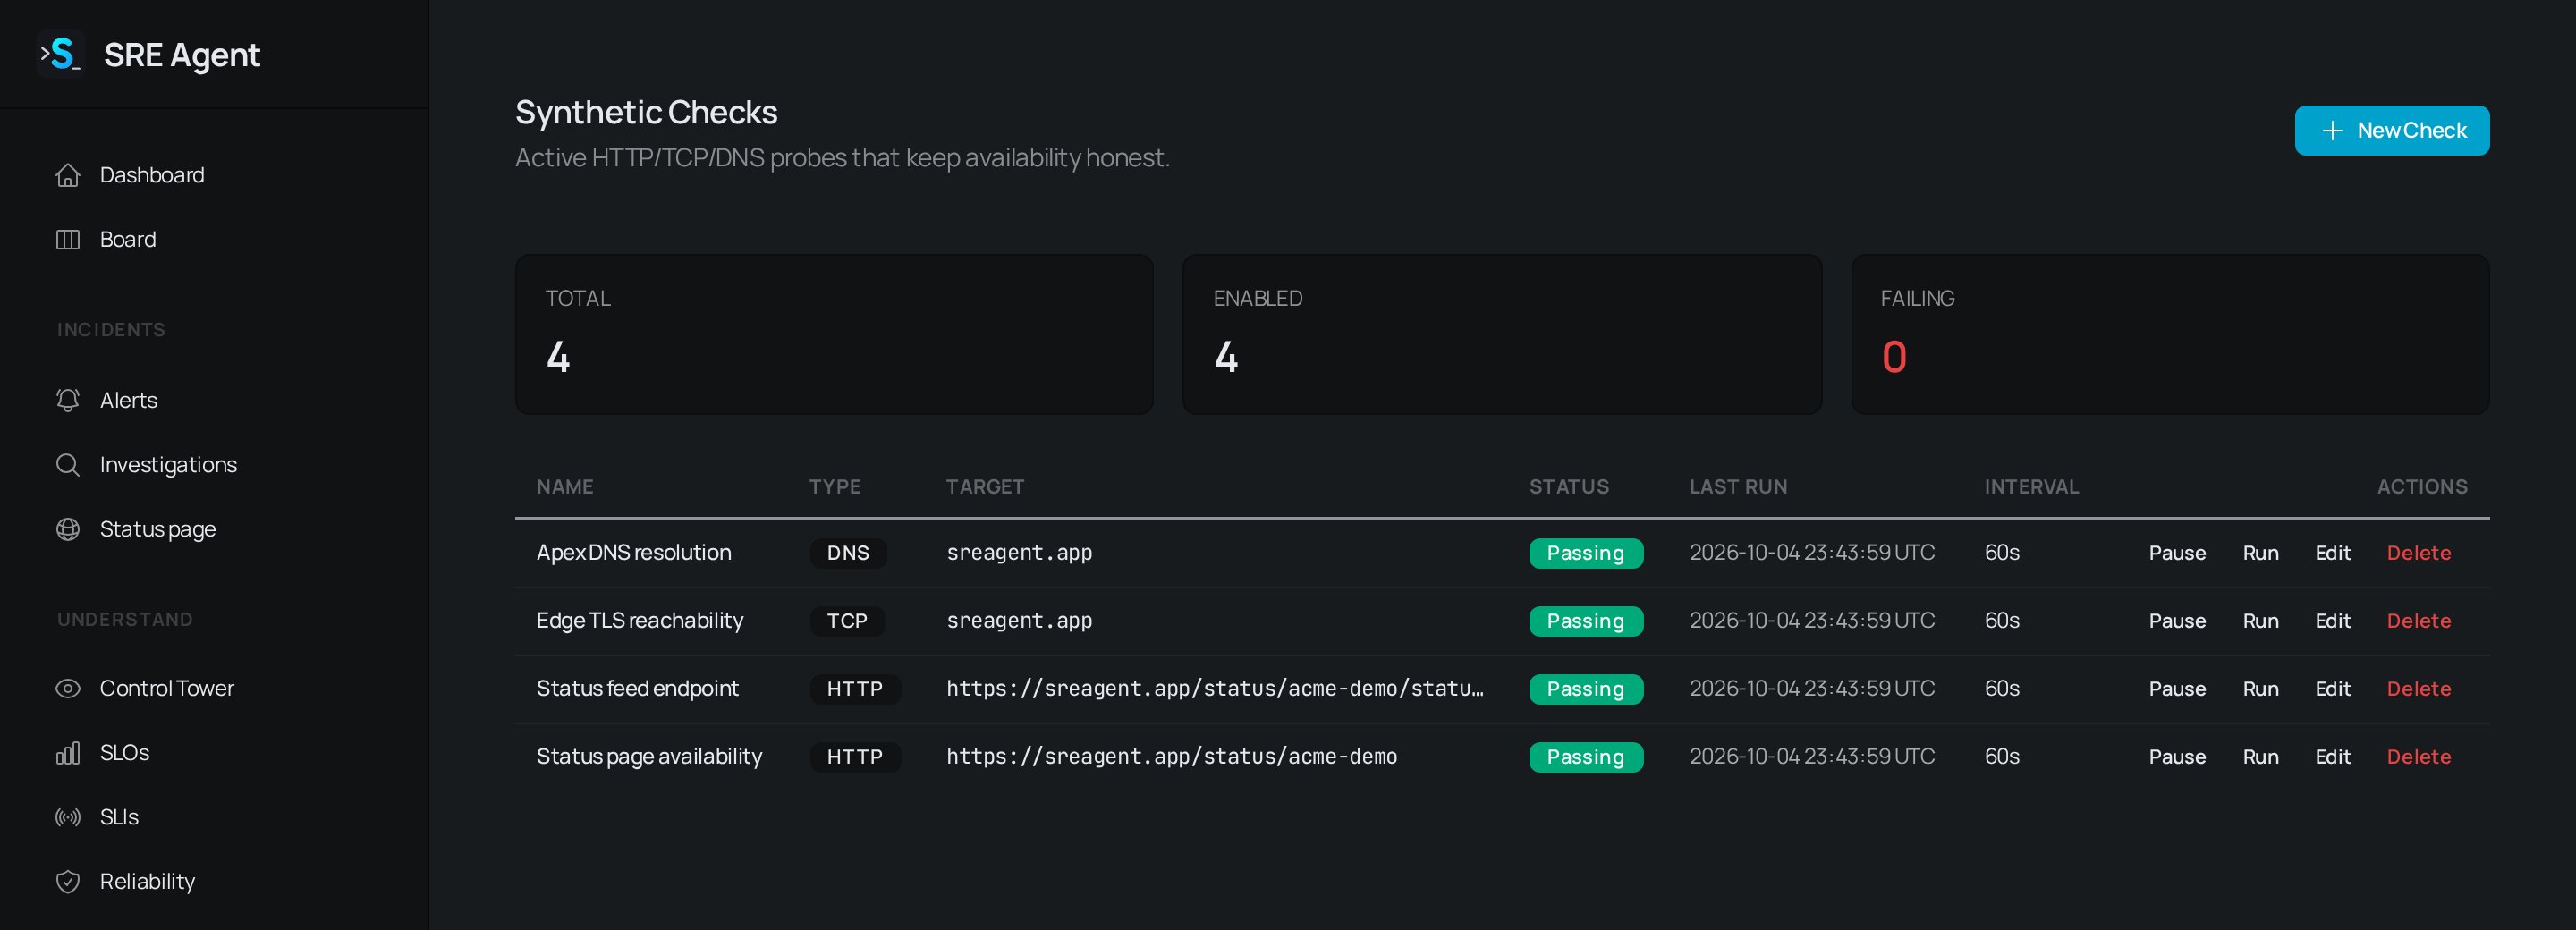
The Synthetic Checks page lists every check with its type, target, status, last run and interval.
Create a check
1
Open Synthetic Checks
Go to Synthetic Checks and click New Check. The page also shows Total, Enabled and Failing counts for all your checks.
2
Name it and choose a type
Enter a Name and pick a Type: HTTP, TCP or DNS.
3
Set the target
The target field depends on the type:
4
Set timing and alerting
Interval is in seconds with a minimum of 60. Timeout is in milliseconds. Choose the Alert severity, set Failures before alert (default 3), and keep Alert on failure ticked if you want an alert. Leave Enabled ticked to start probing.
5
Choose where to probe from
Under Probe from, tick one or more locations. The default location, which the app labels in-cluster, runs the probe from SRE Agent’s own default vantage point. It does not mean your cluster. When extra probe regions are offered, each appears as its own checkbox named by region code, and probing from several lets you tell a regional problem from a real outage. With more than one location selected, Locations that must fail before it counts as down decides how many must fail at once. Leave it blank to require all of them.
6
Link it to a service (optional)
Fill Validates deployments of (optional) with a service name to tie the check to that service’s deploys. Its SLO then gates that service’s deploys, and its alerts are tagged with the service. Leave it blank to just monitor.
7
Save
Click Save. Click Run on the row to probe immediately instead of waiting for the next interval.
What you see
The list shows each check’s Status, Last run and Interval. Row buttons let you Pause (or Resume), Run a probe now, Edit or Delete. A paused check shows Paused instead of its last result, because nothing is probing it. Members and admins manage checks. Viewers can read them. Click a check to open its page:- Current status, Consecutive failures, Interval and Timeout at the top.
- Uptime for the last 1h, 24h, 7d and 30d, with probe counts and average latency.
- Recent latency, a chart that also marks deploys.
- By location, shown when the check probes from several places. One location failing while the others pass points at that vantage point, not at your target.
- Recent probe results with the time, location, result, status code, latency and error detail. Latency is the target’s response time only. Hover it for the breakdown.
Feed an SLO
On the check’s page, click Create availability SLO to build an SLI and an SLO from the check’s own results (target 99.9% over 30 days), or Create latency SLO to measure how fast the endpoint answers. The latency SLO starts with a threshold equal to the check’s timeout, so adjust it on the SLI. Backing SLIs lists everything the check feeds. A check never reads as 100% when it has not run. An SLO backed by a check shows no data until the first probe completes. See Set up SLOs.Alerts and labels
When a check fails the configured number of times in a row, it raises an alert at the severity you chose. The alert carries the check ID, its type and its target as labels. When the check is linked to a service, the alert also carries that service as a label, so deploy correlation and the AI investigation can tie the failure to what you shipped. Runbooks can read these labels. See Runbooks.Related
- Triage alerts: where a failing check raises its alert.
- Gate deploys on reliability: gate deploys on a check’s SLO.
- Limits: how many checks each plan allows.