> ## Documentation Index
> Fetch the complete documentation index at: https://docs.sreagent.app/llms.txt
> Use this file to discover all available pages before exploring further.
# Improve your alert rules
> Turn noisy or weak alert rules into evidenced suggestions you can apply as a pull request, apply to Grafana, or dismiss.
export const Plan = ({tier}) => {tier} plan;
SRE Agent studies the alert rules you already have and proposes changes backed by evidence: how often a rule fired and how many investigations came of it. You review each proposal on the **Suggestions** page and apply or dismiss it.
The Suggestions page is available on every plan. Opening a pull request needs the GitHub App, which is part of [fix requests](/guides/fix/fix-requests) on the Business plan.
 ## Ask for an improvement
Open the alert message SRE Agent posted in your channel.
SRE Agent replies in the thread with a proposal for that rule, or tells you why it cannot make
one, for example when the alert has no rule behind it or the source keeps no rule list.
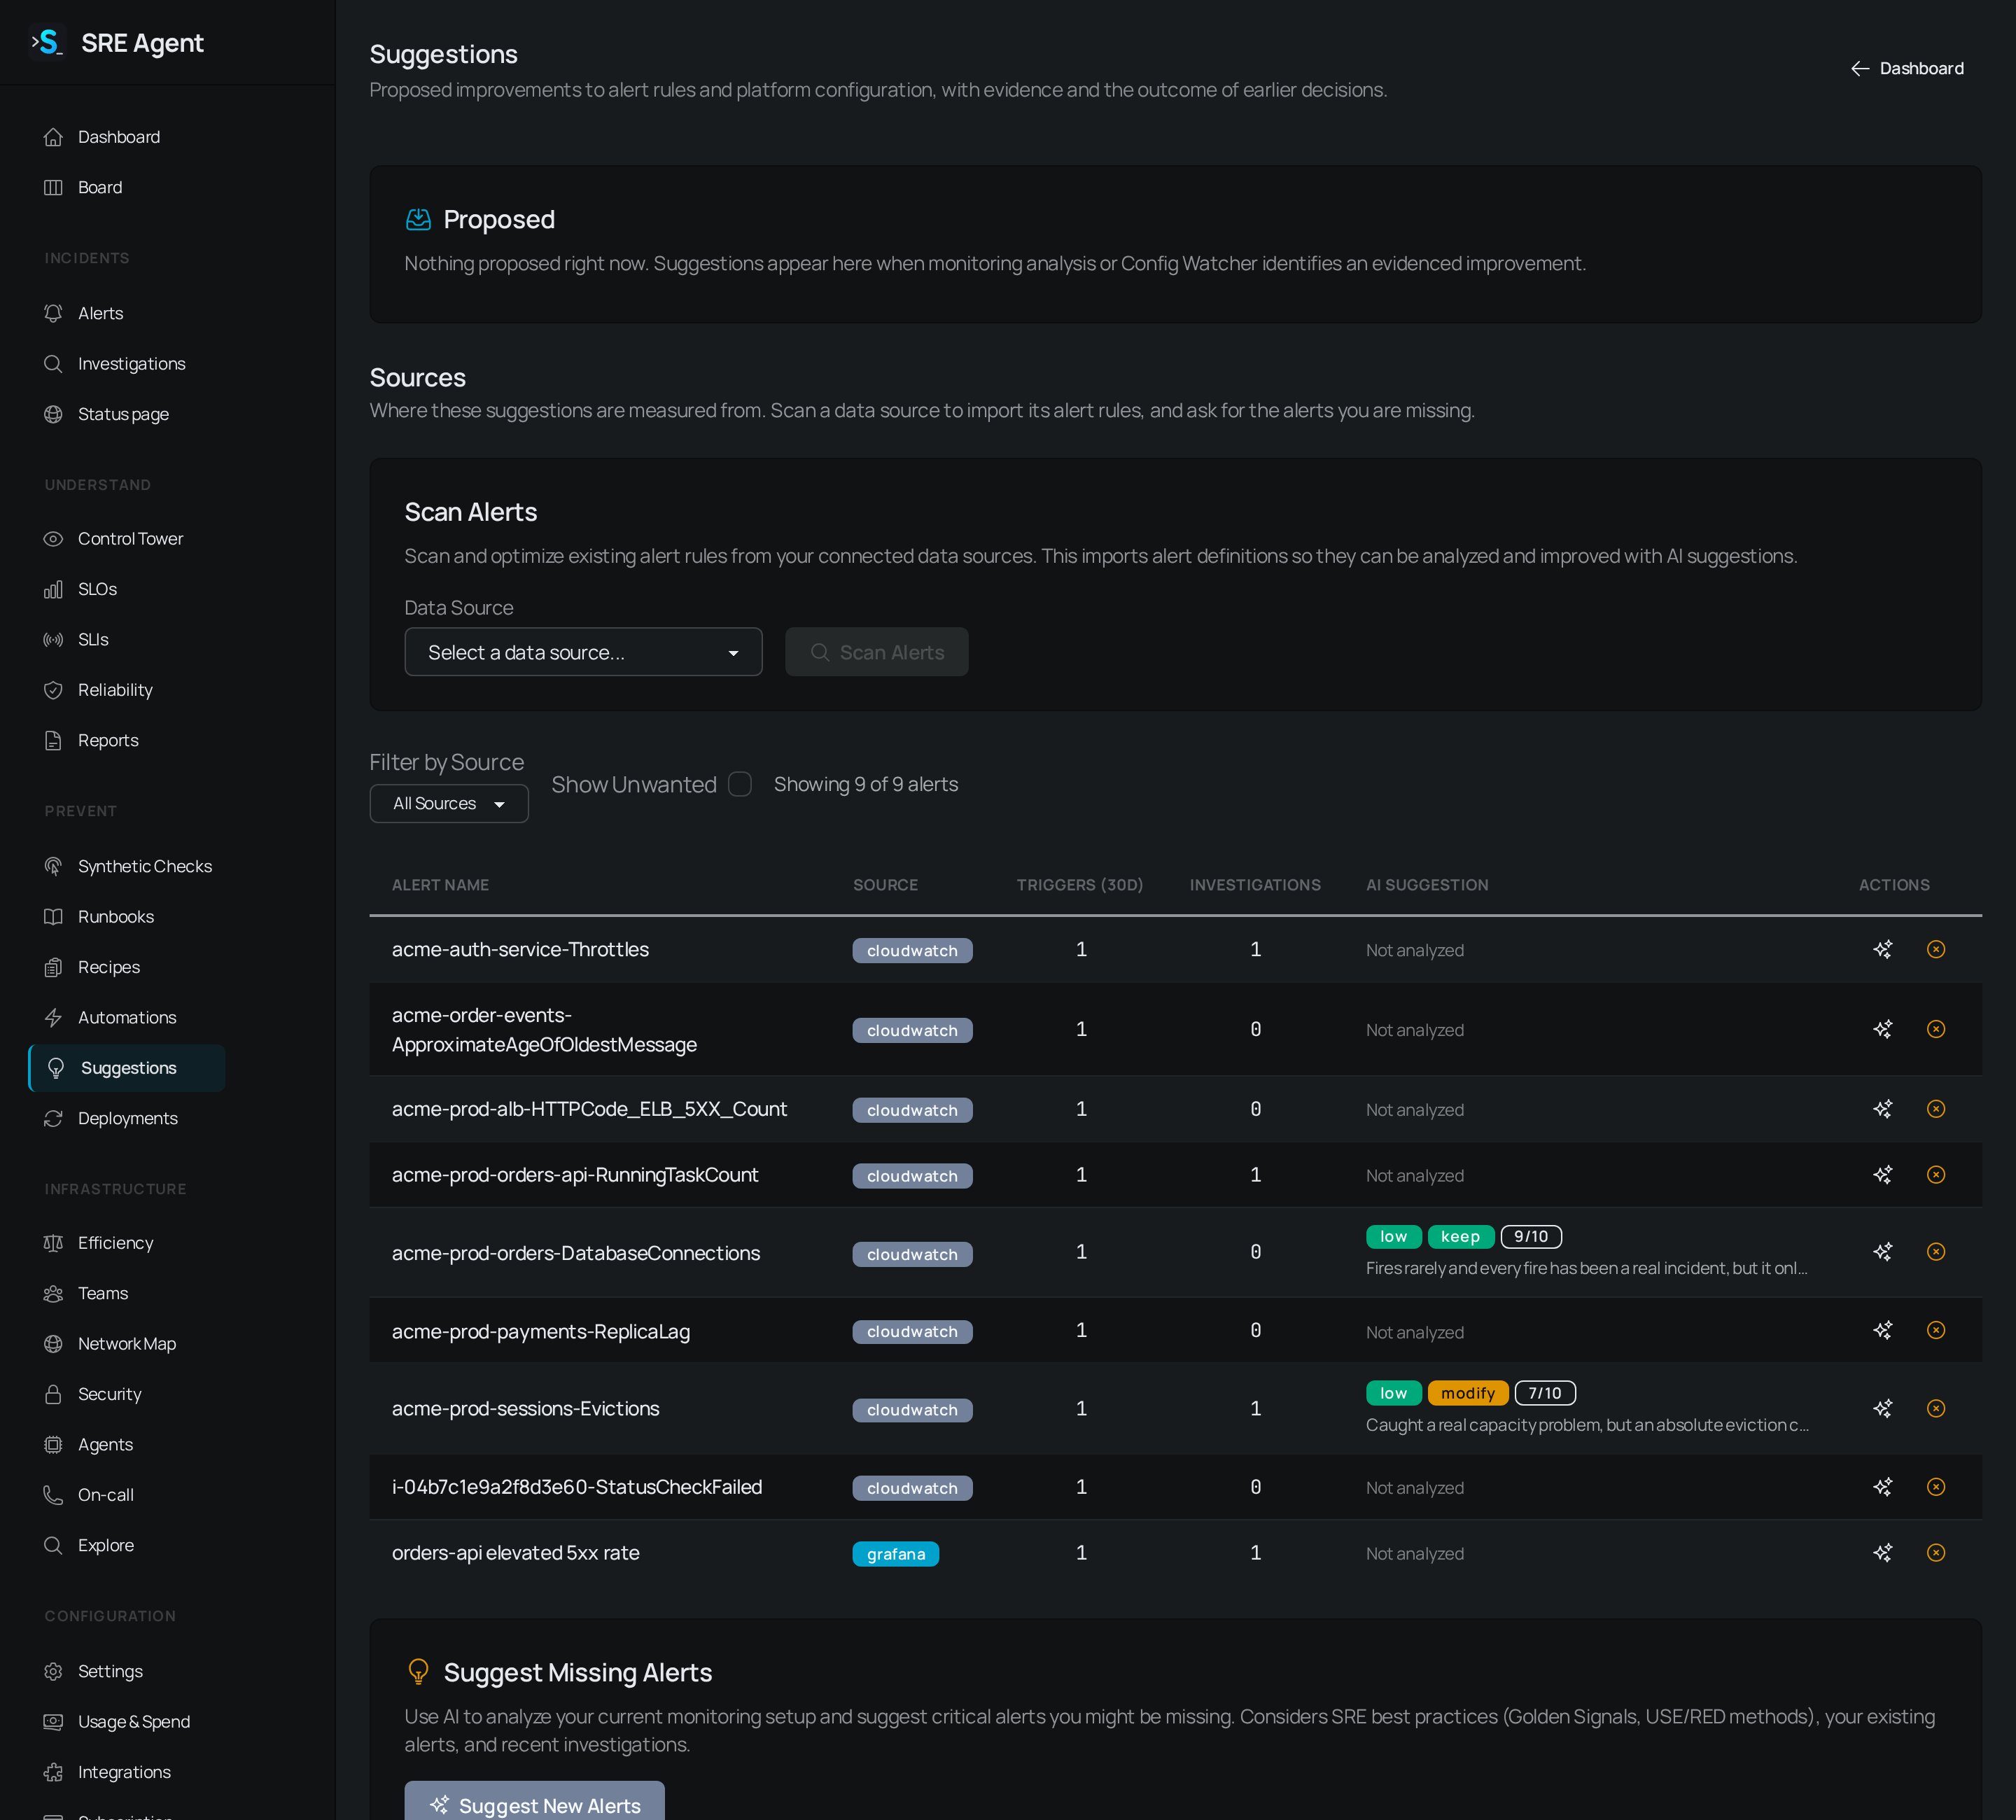
The proposal also appears on the **Suggestions** page in the app, under **Proposed**.
You can also fill the inbox from the page itself. Under **Sources**, pick a data source and click **Scan Alerts** to import its alert rules (a Grafana or CloudWatch data source). The same section can suggest alerts you are missing. Both need the member role.
## Read the lists
**Proposed** holds every open suggestion. Each card shows its title, the evidence, and the exact change it would make. A card that was applied before and came back says so, with the path taken, who took it and when.
**History** holds everything applied, dismissed or failed, plus applies still in flight. Each row shows how it was applied (**written directly**, **as a pull request**, or **in local configuration**), who applied it and when. A pull request apply links to the pull request.
Each list shows 50 rows. Click **Load 50 more** to widen it. A count with a `+` means more rows are waiting.
## Apply or dismiss
Each action asks you to confirm first. The confirmation names the change and where it goes.
| Button | What it does | Who can use it |
| - | - | - |
| **Open a PR** | Sends the change as a pull request against the repository that declares the rule. Nothing is written to your monitoring system. | Admins |
| **Accept and apply** | Writes the change straight to Grafana, when the proposal carries a full rule body. | Admins |
| **Dismiss** | Hides the suggestion and keeps it from coming back for 30 days. | Members and above |
**Accept and apply** shows only while the write would land the change the proposal was measured from. If someone edited the rule since, use **Open a PR** so the edit is not reverted. A rule managed by Grafana's file-based provisioning is refused by name, because a write from here could not change it.
If an apply fails, the card stays in **History** with the reason printed on the row. Fix the cause, then use the buttons there to try again. When no button is available, the card says why, such as the GitHub App not being installed.
The same buttons exist on the Slack reply, with the same role requirements.
## Suggestions about your setup
The page also lists configuration proposals from Config Watcher, an optional agent that reviews your data sources, alert routing and other settings. An org admin turns it on under **Settings**, **Config Watcher**, where you also pick a policy. It is off by default. Most proposals link to the setting to review; the one change you can apply from the page is filling a missing region on a telemetry binding, with **Apply locally**.
## Related
* [Triage alerts](/guides/respond/alerts): the alerts these suggestions come from.
* [Work incidents from Slack](/guides/respond/slack): the Improve this alert button.
* [Connect your data](/guides/get-started/connect-your-data): connect Grafana or CloudWatch so rules can be scanned.
* [Plan matrix](/guides/reference/plan-matrix): which plans include pull requests.
This documentation is built and hosted on [Mintlify](https://mintlify.com), a developer documentation platform.
## Ask for an improvement
Open the alert message SRE Agent posted in your channel.
SRE Agent replies in the thread with a proposal for that rule, or tells you why it cannot make
one, for example when the alert has no rule behind it or the source keeps no rule list.
The proposal also appears on the **Suggestions** page in the app, under **Proposed**.
You can also fill the inbox from the page itself. Under **Sources**, pick a data source and click **Scan Alerts** to import its alert rules (a Grafana or CloudWatch data source). The same section can suggest alerts you are missing. Both need the member role.
## Read the lists
**Proposed** holds every open suggestion. Each card shows its title, the evidence, and the exact change it would make. A card that was applied before and came back says so, with the path taken, who took it and when.
**History** holds everything applied, dismissed or failed, plus applies still in flight. Each row shows how it was applied (**written directly**, **as a pull request**, or **in local configuration**), who applied it and when. A pull request apply links to the pull request.
Each list shows 50 rows. Click **Load 50 more** to widen it. A count with a `+` means more rows are waiting.
## Apply or dismiss
Each action asks you to confirm first. The confirmation names the change and where it goes.
| Button | What it does | Who can use it |
| - | - | - |
| **Open a PR** | Sends the change as a pull request against the repository that declares the rule. Nothing is written to your monitoring system. | Admins |
| **Accept and apply** | Writes the change straight to Grafana, when the proposal carries a full rule body. | Admins |
| **Dismiss** | Hides the suggestion and keeps it from coming back for 30 days. | Members and above |
**Accept and apply** shows only while the write would land the change the proposal was measured from. If someone edited the rule since, use **Open a PR** so the edit is not reverted. A rule managed by Grafana's file-based provisioning is refused by name, because a write from here could not change it.
If an apply fails, the card stays in **History** with the reason printed on the row. Fix the cause, then use the buttons there to try again. When no button is available, the card says why, such as the GitHub App not being installed.
The same buttons exist on the Slack reply, with the same role requirements.
## Suggestions about your setup
The page also lists configuration proposals from Config Watcher, an optional agent that reviews your data sources, alert routing and other settings. An org admin turns it on under **Settings**, **Config Watcher**, where you also pick a policy. It is off by default. Most proposals link to the setting to review; the one change you can apply from the page is filling a missing region on a telemetry binding, with **Apply locally**.
## Related
* [Triage alerts](/guides/respond/alerts): the alerts these suggestions come from.
* [Work incidents from Slack](/guides/respond/slack): the Improve this alert button.
* [Connect your data](/guides/get-started/connect-your-data): connect Grafana or CloudWatch so rules can be scanned.
* [Plan matrix](/guides/reference/plan-matrix): which plans include pull requests.
This documentation is built and hosted on [Mintlify](https://mintlify.com), a developer documentation platform.